Example: dag-showcase
dag-showcase is the best first project to open in Rime Editor because it is small enough to understand in one sitting and broad enough to show the product.
Project Shape
Section titled “Project Shape”The example starts with patient demographics and longitudinal lab visits:
- id: patients_source  kind: source  path: data/patients.csv
- id: labs_source  kind: source  path: data/lab_visits.parquet
It then rolls labs up per patient, joins demographics to lab features with SQL, builds expression-derived risk features, and ends with report-friendly statistical nodes.
Why It Shows The Editor Well
Section titled “Why It Shows The Editor Well”| Workflow | Where to look |
|---|---|
| File ingress | patients_source, labs_source |
| Expression language | lab_load, risk_index, repeat_visitors |
| SQL with named inputs | patient_lab_wide, sql_cohort_refine |
| Dataset scanning | patient_lab_wide, risk_index, site_outcomes |
| Statistical outputs | crp_vs_baseline, site_age_chisq |
| Report preview | the generated report tab |
Walkthrough
Section titled “Walkthrough”- Open
examples/dag-showcase. - Run the DAG.
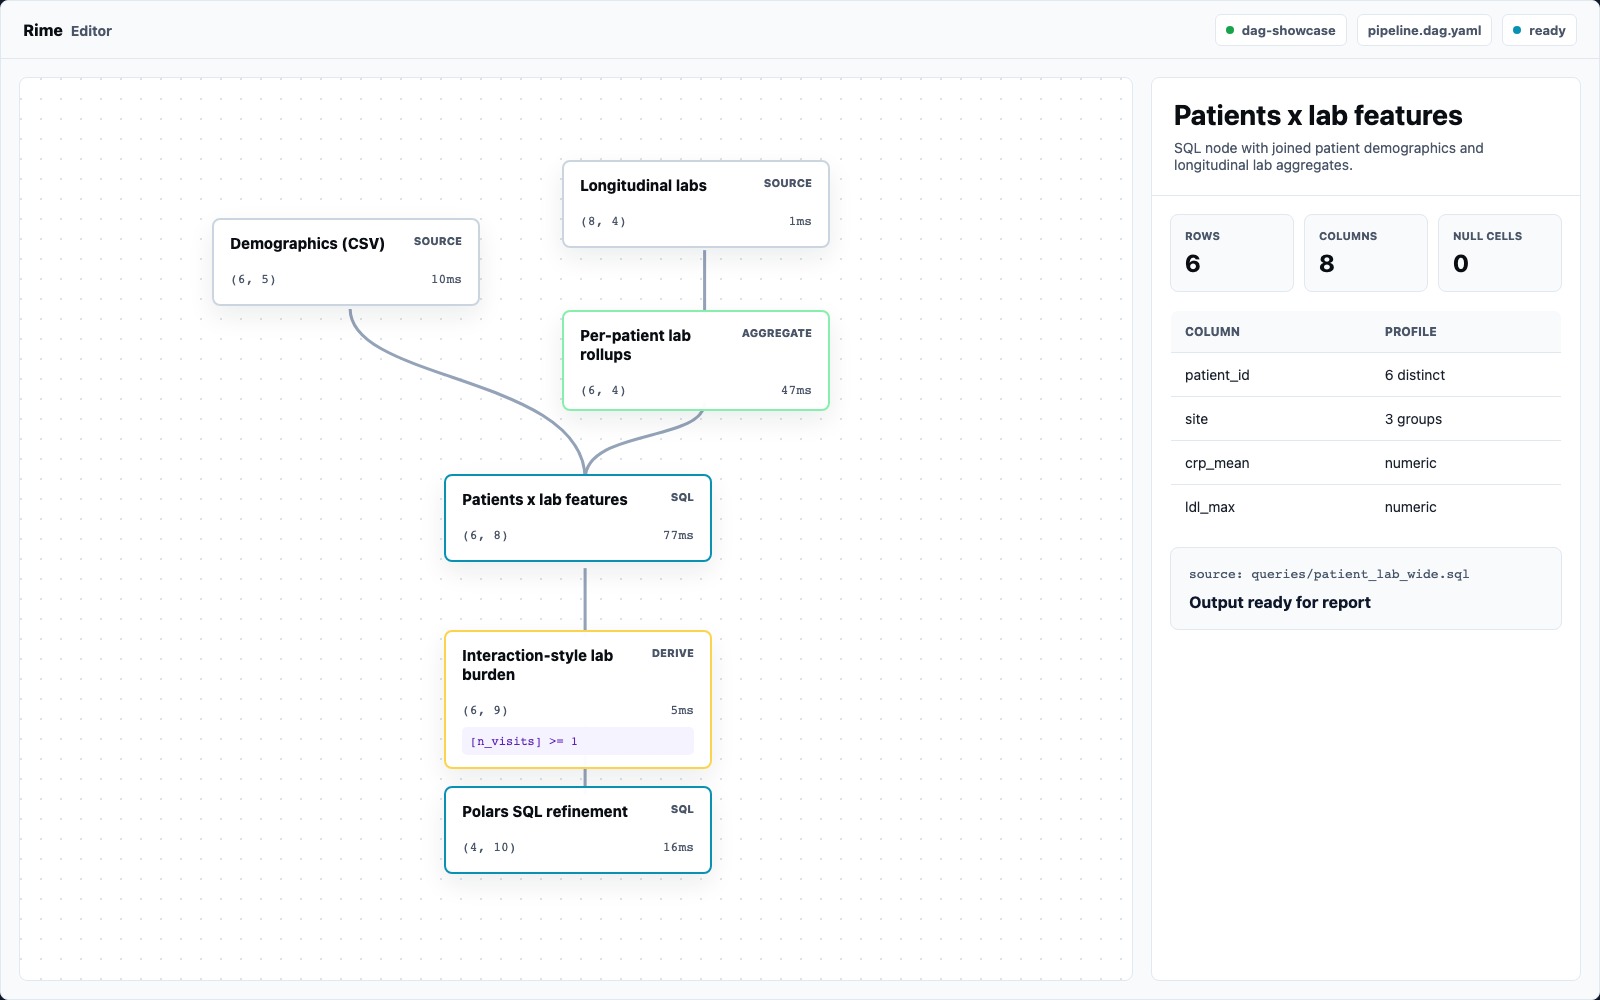
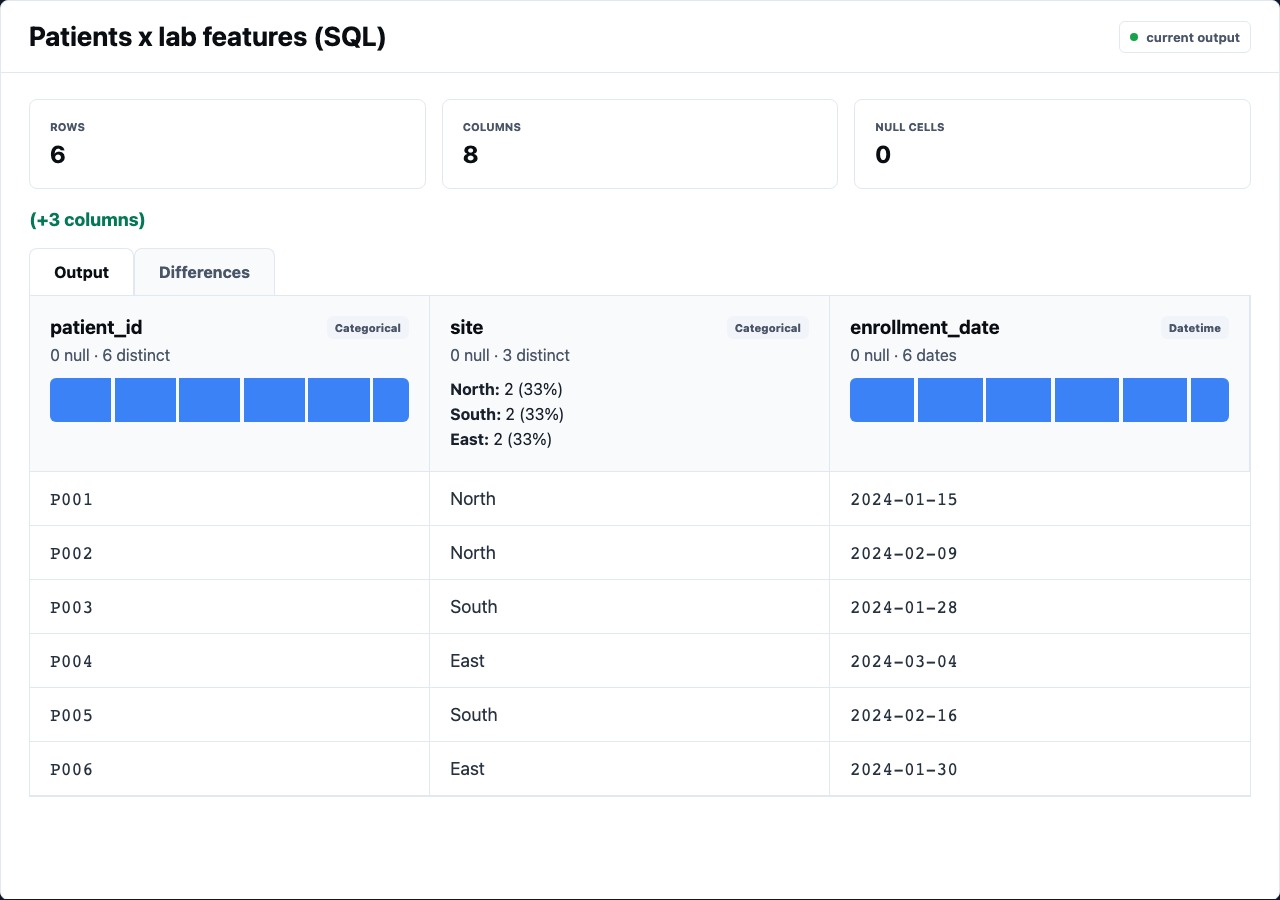
- Select
patient_lab_wide. - Confirm the preview shows a joined patient/lab table and the SQL source.
- Select
lab_loadand inspect the derived feature column. - Select
site_outcomesand check that the aggregate output is one row per site. - Open the report preview and inspect the output sizes and statistical sections.
What To Notice
Section titled “What To Notice”The point of the example is not the medical story. The point is the review loop:
- graph structure tells you where data came from
- table previews show what each step produced
- YAML/spec remains available when visual controls are not enough
- statistical nodes produce reportable object outputs
- the report collects the same run evidence into a shareable artifact
Expression Nodes In The Demo
Section titled “Expression Nodes In The Demo”The feature-building nodes are deliberately readable:
- id: risk_index kind: derive inputs: [lab_load] as: risk_index expr: "coalesce([crp_mean], 0) * 2.0 + coalesce([ldl_max], 0) * 0.05"This is a good dividing line for Rime Editor: if a formula is readable in the expression language, keep it as a core node so reviewers can inspect it directly. If it becomes multi-step logic, promote it to SQL/Python/R/JavaScript.
Report Output
Section titled “Report Output”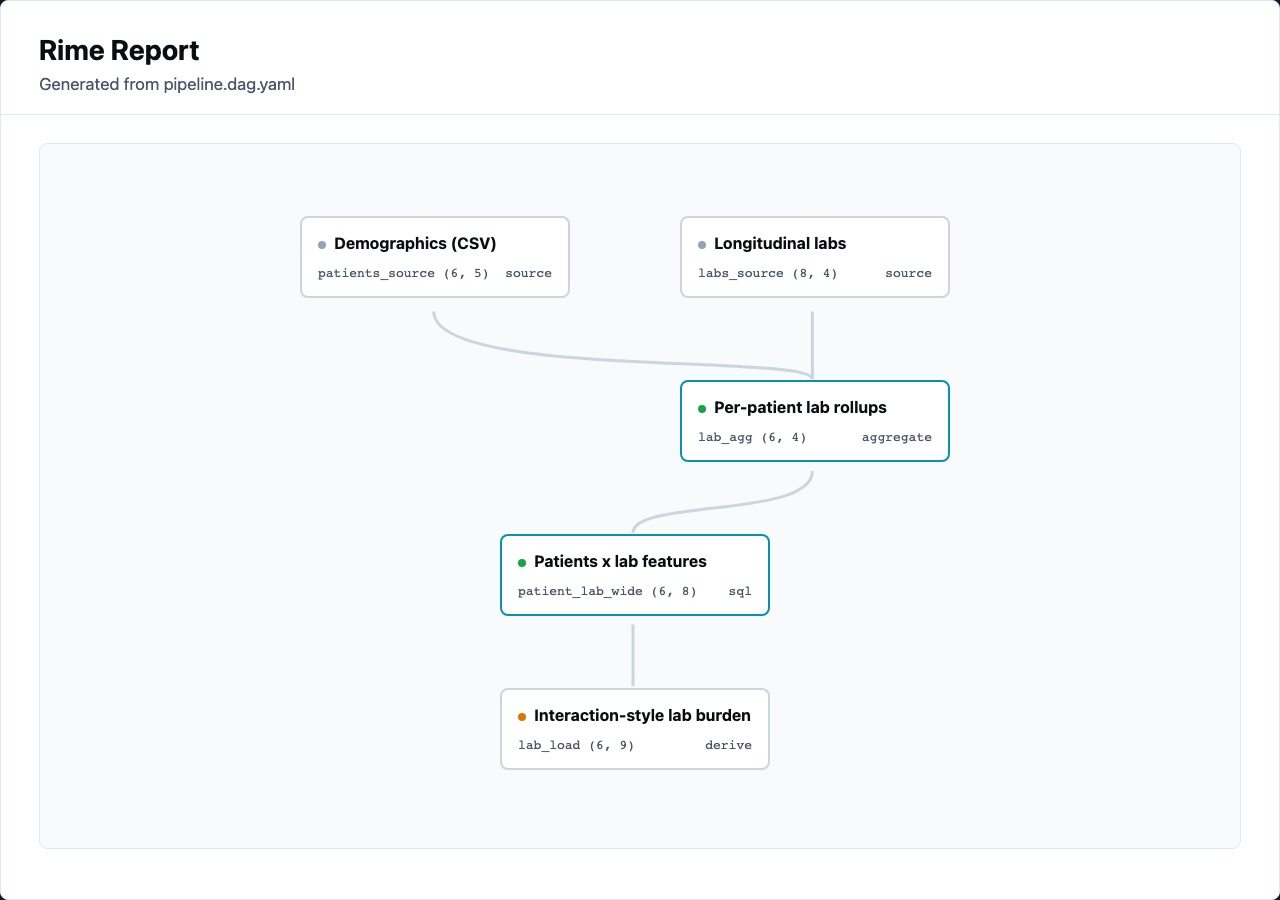
The report should make the pipeline reviewable without reopening the editor:
- DAG overview with output sizes
- table sections for data-producing nodes
- stat blocks for object-producing nodes
- warnings near statistical results
- browser-openable HTML artifact